 |
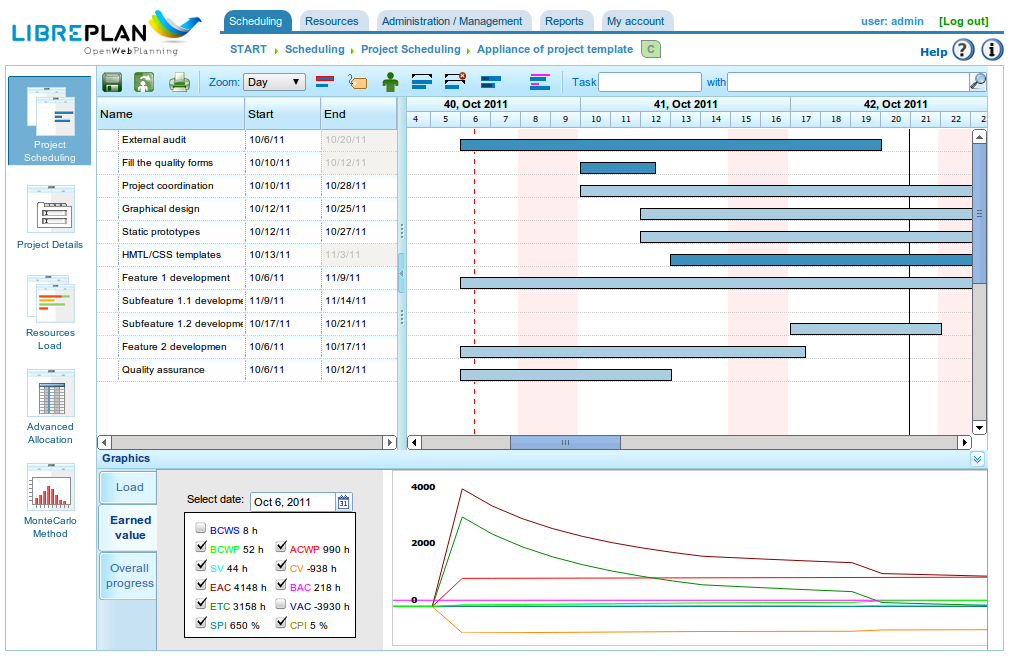
Global company view |
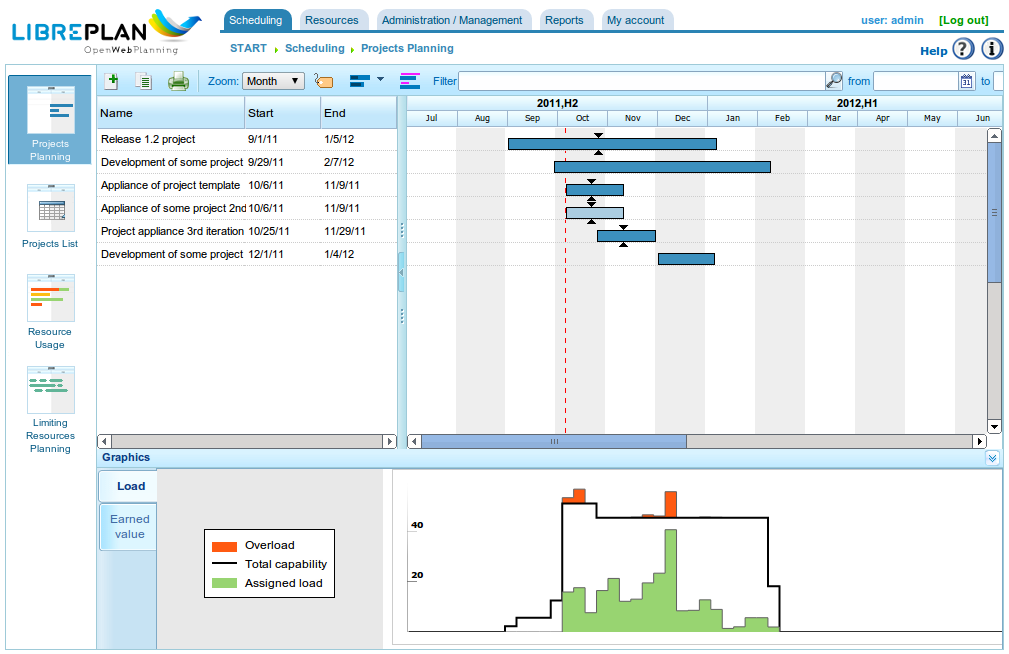
LibrePlan has a multiproject focus and thanks to it you can analyse the projects currently being developed by the company in a jointly way
The global company view screen is the home screen you are redirected after login. You can easily see in a chart all the key information about the status of each project:
- Start and end dates
- Global progress
- Number of hours invested in the project
- Deadline of the project
 |
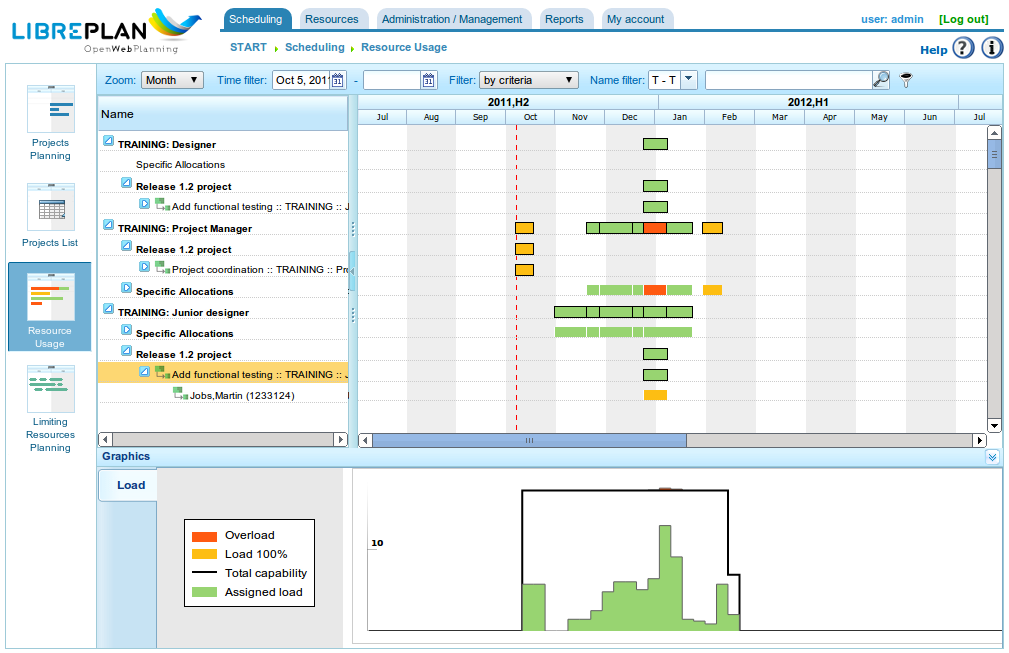
Resource load view |
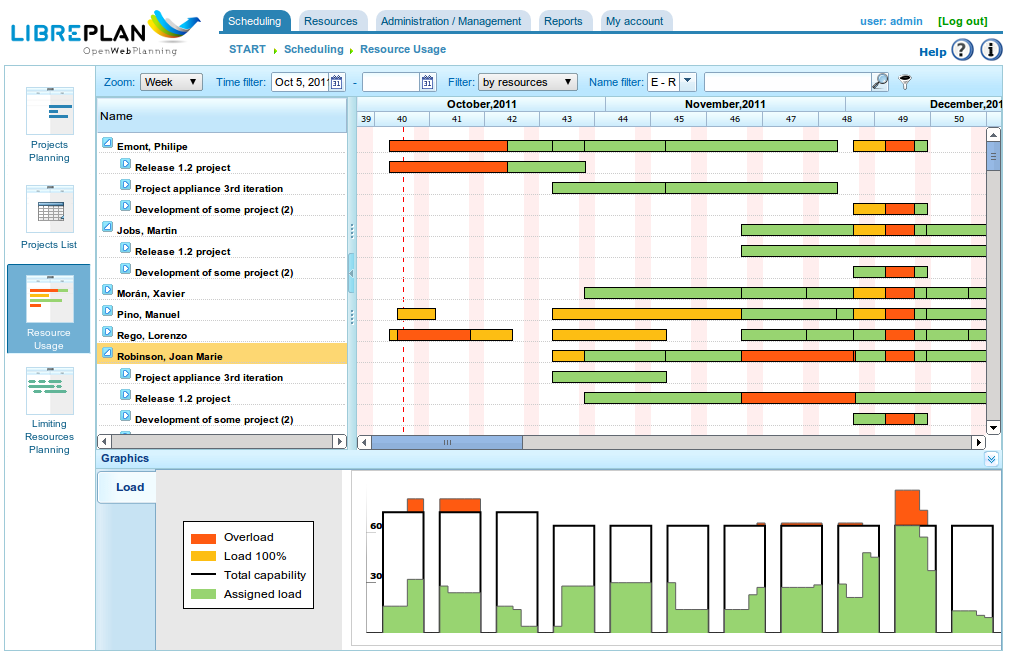
In LibrePlan resources are shared among projects and with the resource load view you can analyse their load status in a graphical and powerful way. You are able to discover when they are overloaded or when there is room to accept more work.
The screen consists of a chart with a row per resource where the tasks he has assigned are drawn in a timeline. Besides, colors easily allow to identify overload periods as well as free allocation gaps.
 |
Indicators panel |
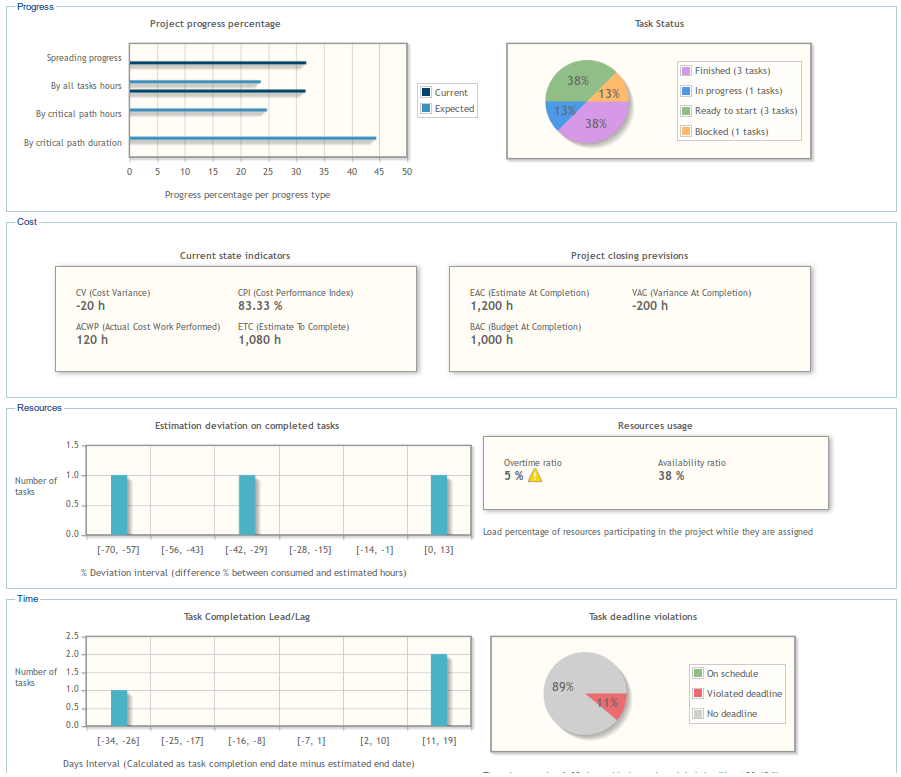
The indicators panel is a project planning perspective which enables to know theproject status in a fast and easy way. It sums up information and contains a set of metrics and charts which analyze how well a project is performing from several points of view:
- Progress dimension. You can compare the current progress of a project against the expected planned value and to know the status of the project activities.
- Cost dimension. Several useful EVM indicators are calculated analyzing how much the project is costing and projecting the current trend to future to estimate the final project cost at end time.
- Resources dimension. The overtime of the allocated resources, their availability and how much is being the task deviation between the planned effort and the actual effort is calculated.
- Time dimenision. The compliance with project and task dealines as well as the deviation between planned end date and actual finish time is analyzed.
 |
Earned Value Management |
Earned Value Management is the gold standard method for measuring and managing achievement in projects. It is used on projects large and small: From buildings to transatlantics, opera to aircraft to zoos and even Olympic games.
LibrePlan provides this technique transparently integrated in the natural cycle of project planning and is calculated for you in an effortless way. It can be applied with project or global company scope.
 |
Criterion load view |
A distinctive feature in LibrePlan is the possibility to analyse in a graphical way the load by criterion, e.g., by resource skills.
With the criterion load view you are able toknow easily if the resources satisfying a specific criterion are working overtime or if they have spare time to receive allocations requiring a criterion in a time period
 |
Budget and Costs |
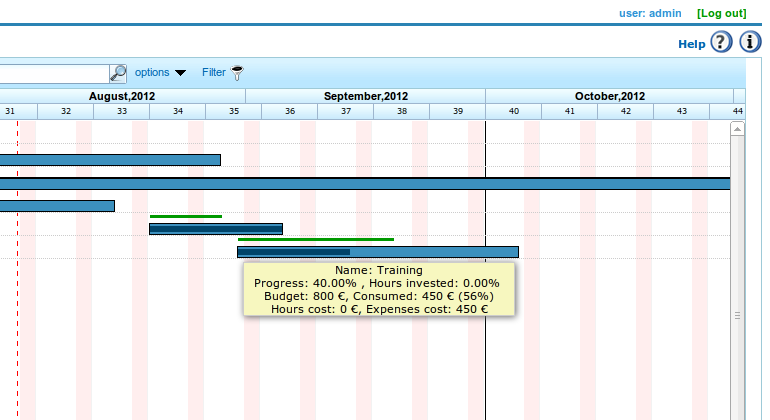
In LibrePlan you measure and control the project cost in a natural way and, besides, you analyze it in an integrated way with the project planning.
Projects have a budget in money and in hours managed through the WBS and you track it through the hours dedicated by the workers during project execution and through the expenses spent in the different project activitities. Hours can have different cost and you specify it by grouping the sources in cost categories.
The cost is incorporated into the Gantt chart and is represented graphically through several bars which visually sum up the budget status of each task.
 |
Reports |
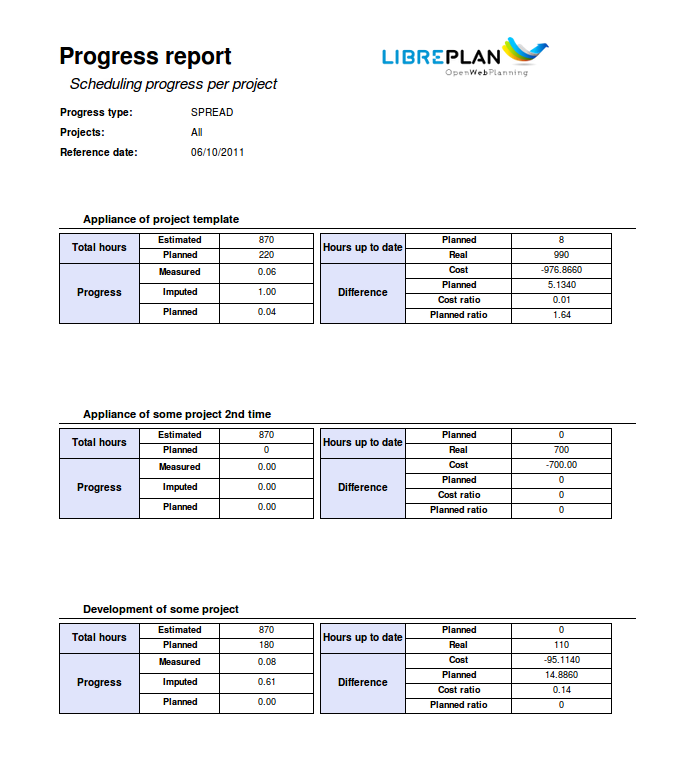
LibrePlan has a powerful reporting system which allows you exploit the planning data saved in the database
Among the existent reports you can find for example:
- A report to know the hours worked by a resource in a period.
- A report to know the progress and status of the tasks of a project.
- A report to have a detailed analysis of the cost of a project.
Reports are provided in three formats:
- HTML
- ODT. Open Document Format. It is the format used by LibreOffice andOpenOffice.